Execution Sequence
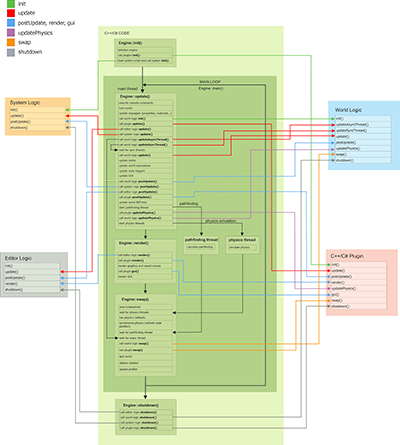
This article focuses on details of the UNIGINE execution sequence. Here you will find what is happening under the hood of the UNIGINE Engine. For a high-level overview of UNIGINE workflow, see the Engine Architecture article.
The internal code of the UNIGINE engine and the logic of your application that can be extended using plugins written in C++ or C#, are executed in the pre-defined order:
- Initialization. During this stage, the required resources are prepared and initialized. As soon as these resources are ready for use, the Engine enters the main loop.
Main loop. When UNIGINE enters the main loop, all its actions can be divided into three stages, which are performed one by one in a cycle:
- Update stage containing all logic of your application that is performed every frame
- Rendering stage containing all rendering-related operations, physics simulation calculations, and pathfinding
- Swap stage containing all synchronization operations performed in order to switch between the buffers
This cycle is repeated every frame while the application is running.
- Shutdown. When UNIGINE stops execution of the application, it performs operations related to the application shutdown and resource cleanup.
The following diagram (clickable) represents the main stages of the UNIGINE execution sequence in default Async Rendering physics mode.
Waiting GPU#
At most times, UNIGINE finishes all its stages in the main loop faster then the GPU can actually render the frame. That is why double buffering is used: it enables to render frames faster by swapping GPU buffers (the back and front ones) into which rendering is performed.
When all scripts have been updated and all calculations on the CPU have been completed, the GPU is still rendering the frame calculated on the CPU. So, the CPU has to wait until the GPU finishes rendering the frame and the rendering buffers are swapped. The period of such waiting time is represented by the Waiting GPU counter in the performance profiler.
If the Waiting GPU time is too high, it may signal that a GPU bottleneck exists, and art content needs to be optimized. But if by that the frame rate is consistently high, it means you still have the CPU resources available to crunch more numbers.
How much time has passed from the moment when all scripts have been updated and all calculations on the CPU have been completed, to the moment when the GPU has finished rendering the frame, also depends on whether the vertical synchronization (VSync) is enabled. If VSync is enabled, the CPU waits until the GPU finishes rendering and the vertical synchronization is performed. In this case, the Waiting GPU counter value will be higher.
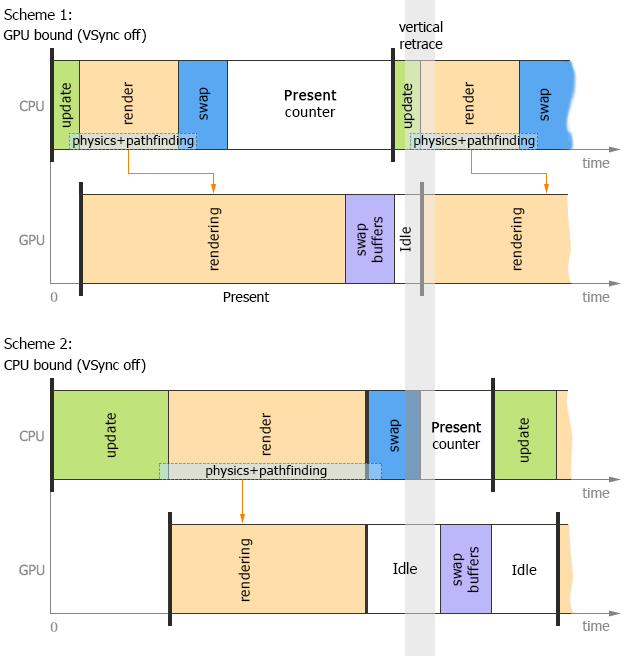
The four schemes below show different scenarios of CPU and GPU performance with VSync disabled and enabled.
The first two schemes show calculation and rendering of the frame when VSync is disabled (in both cases the monitor vertical retrace is ignored):
- Scheme 1. The CPU calculates the frame faster than the GPU can render it. So, the CPU waits for the GPU (the Waiting GPU time is high).
- Scheme 2. The CPU calculations are performed slower than the GPU renders the frame. So, the GPU has to wait while the CPU finishes its calculations. In this case, the Waiting GPU time is small.
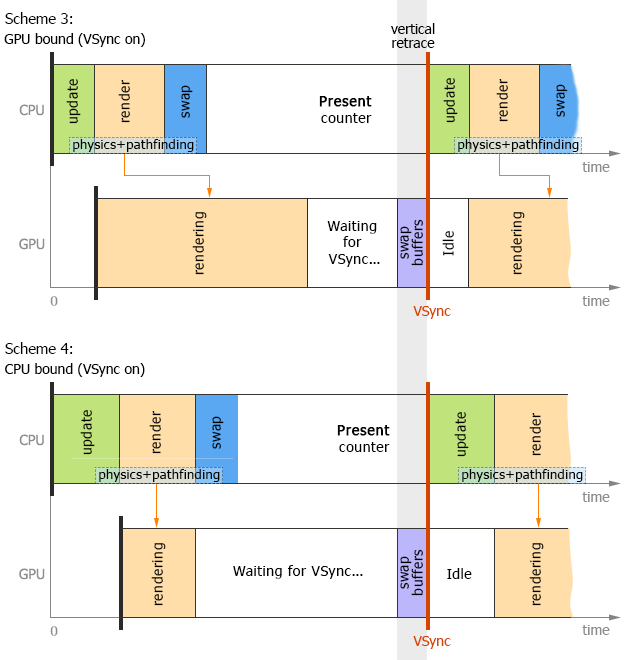
Schemes 3 and 4 show calculation and rendering of the frame when VSync is enabled (the monitor vertical retrace is taken into account):
- Scheme 3. The CPU calculates the frame faster than the GPU can render it, and the CPU waits for the GPU. However, in this case, both the CPU and the GPU also wait for VSync.
- Scheme 4. The CPU calculates the frame slower than the GPU renders it. In this case, the GPU waits not only the CPU finishes its calculations, but also VSync.
Physics and Pathfinding Threads#
The engine uses all available threads to update visible nodes simultaneously, and multi-threaded physics (in the asynchronous physics update mode) and pathfinding which is updated in parallel with the rendering stage.
The following scheme illustrates threads in the process of calculation and rendering of a frame with Async Rendering physics mode enabled:
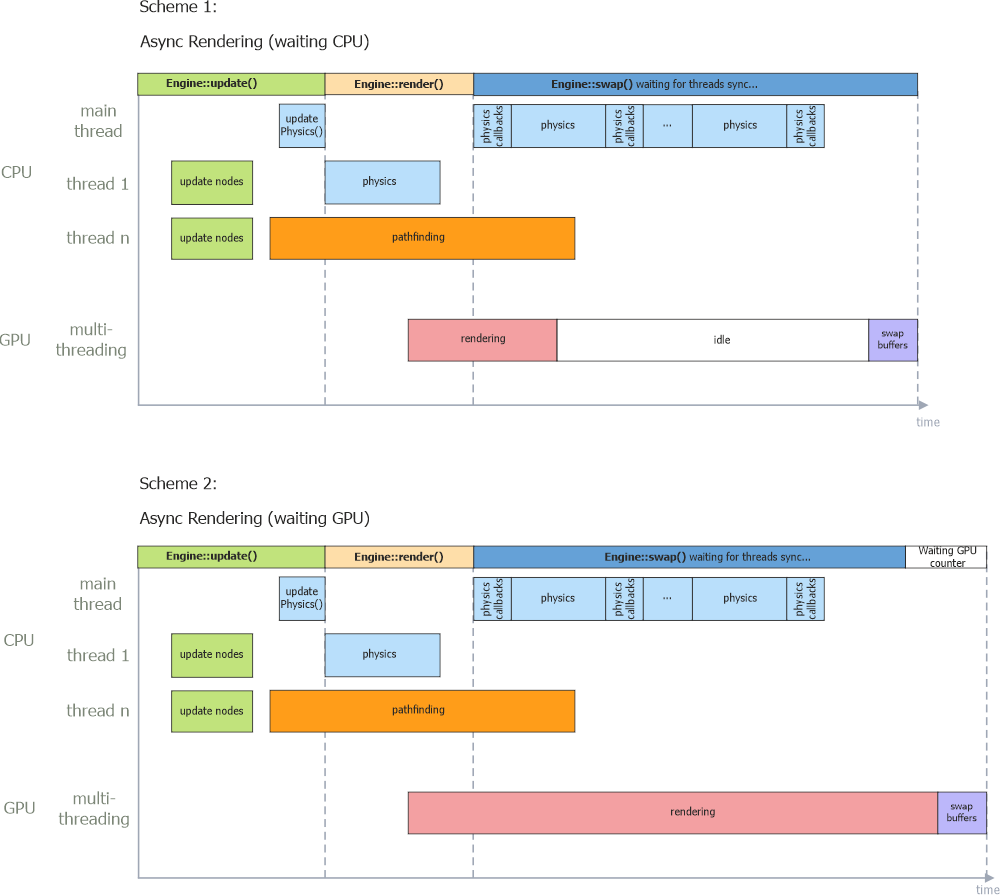
The first physics frame is calculated in parallel with the rendering in the main thread. Then all the rest of the physics frames are updated in the main thread. All the client's code, for example, updatePhysics(), is called in the main thread as well.
The last two schemes illustrate how physics gets updated in the Before Rendering mode:
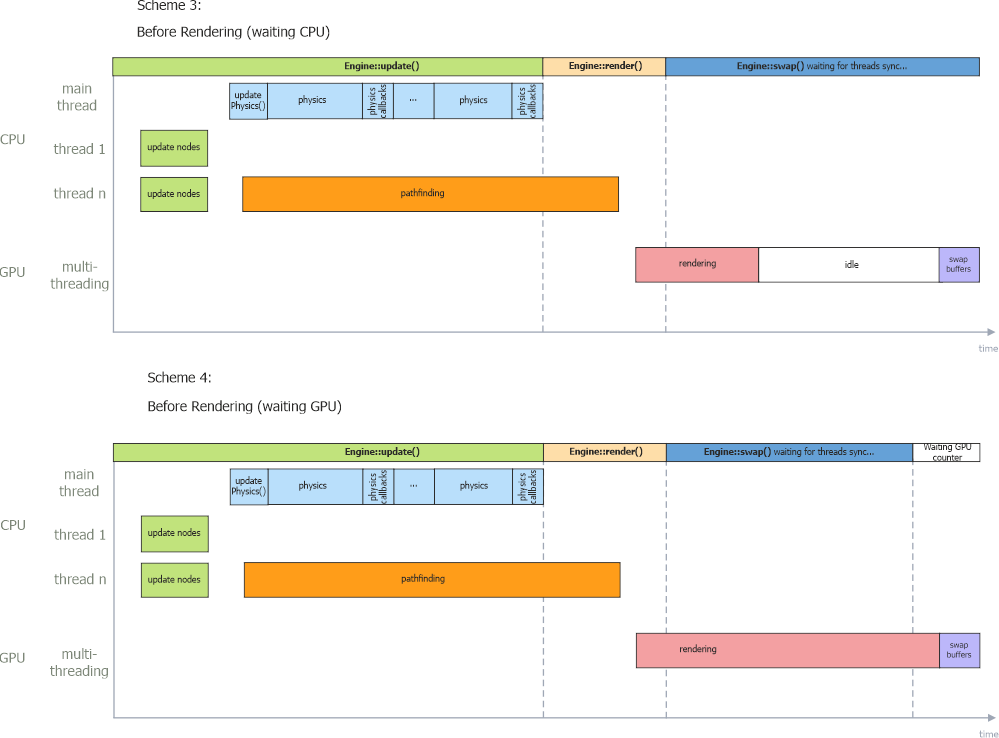
In both cases either a CPU or a GPU has to wait for one another to finish its rendering and swap to synchronize.
Correlation between Rendering and Physics Framerates#
The rendering framerate usually varies, while, as we have already mentioned before, physics simulation framerate is fixed. This means that your update() and updatePhysics() functions from the world logic are called with different frequency.
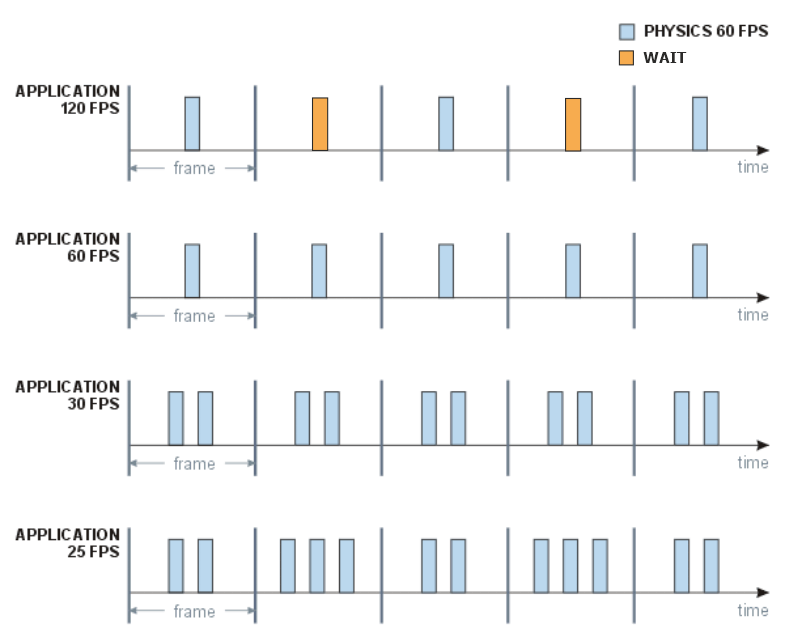
The picture above describes what happens, when the physics framerate is fixed to 60 FPS, and the rendering framerate varies. In general, there are three possible cases:
- The rendering framerate is much higher. In this case, physical calculations are done once for two or more frames. This does not raise any problems, as positions of moving objects are interpolated between the calculations. The Stable FPS mode is enabled by default to avoid framerate jumping and dropping (see the detailed explanation in the following section).
- The rendering framerate is the same or almost the same. This situation is also ok, the calculations are performed once per frame; the physics keeps pace with the graphics and vice versa.
The rendering framerate is much lower. This is where problems begin. First, as you see from the picture, the physics should be calculated twice or even more times per frame, and that does not speed up the overall rendering process. Second, you cannot set the physics framerate too low, as in this case the calculations will lose too much precision.
NoticeThere is no point in setting the number of iterations too high. UNIGINE checks whether the next iteration can be performed within physics budget limit, and if not, it is delayed and moved to the next rendering frame.
Stable FPS#
When the application's rendering framerate is higher than the physics updates, some frames with physics updates will take more time to calculate. This results in application's framerate jumps and drops which can lead to unstable simulations (especially with input and interactivity involved).
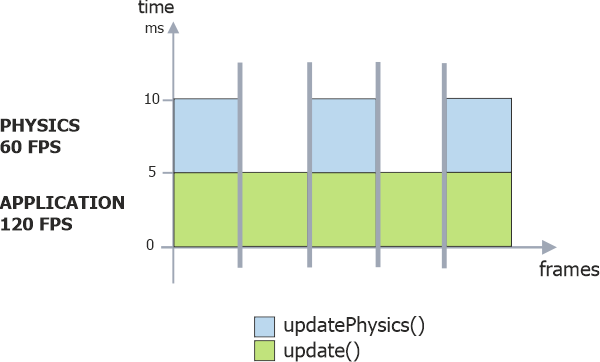
To make the framerate more stable, the Stable FPS feature is enabled by default. It adds an Idle state if the current frame took less than the previous one (usually due to lack of Physics calculations). This ensures that each frame takes the same amount of time effectively eliminating framerate's pulsation.
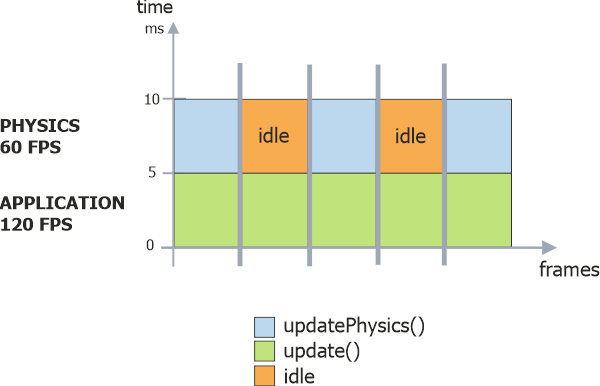
You can switch this feature off in case your application is used for machine learning or for grabbing frame sequences (Video Grabber), when smoothness is not important.
Synchronizing Engine FPS with Physics One#
As it was mentioned, in case the Engine framerate is higher than the physics one, the results of physics calculations are interpolated between the frames. But you can enable physics to be calculated each rendered frame by synchronizing the Engine framerate to the physics one (setting the SyncEngineUpdateWithPhysics flag via code). In this mode, there is no twitching of physical objects if they have non-linear velocities. This flag has no effect if the Engine FPS is lower than the physics one.
The information on this page is valid for UNIGINE 2.19 SDK.
